
5 Visual Diagram Layouts for Explainer Reels
Turn complex ideas into clear 9:16 explainers using 5 visual diagram layouts—from 3-step flows to conversion funnels—with Seedream examples.
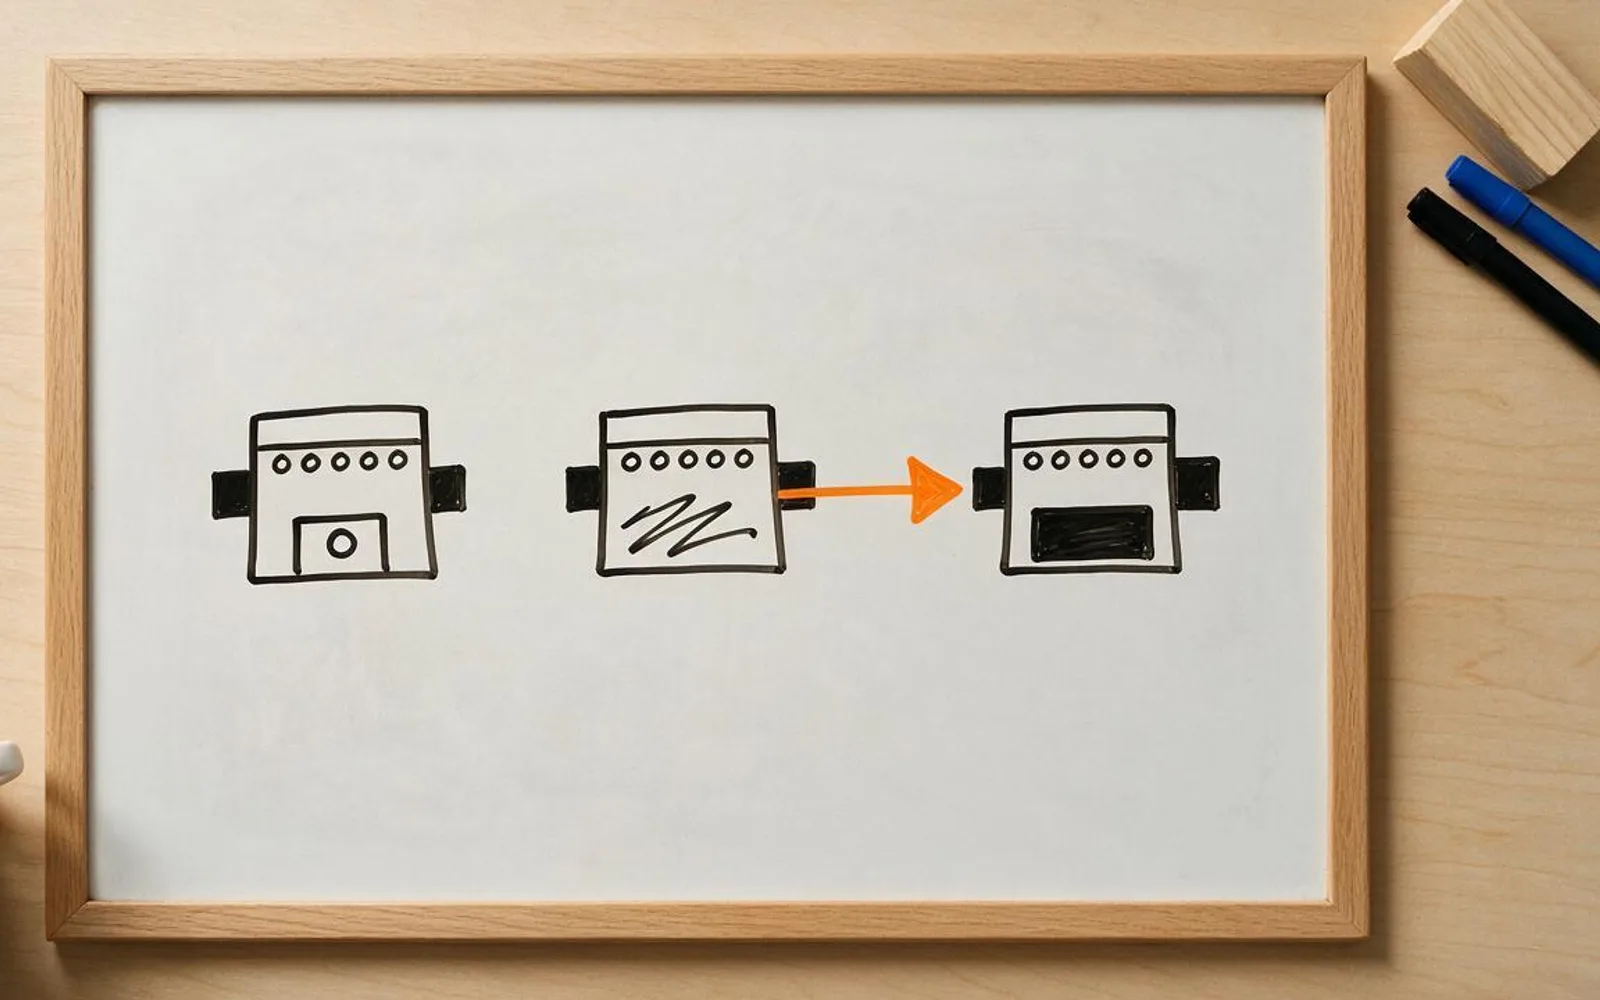
When an explainer reel talks about processes, comparisons, or numbers without a clear spatial layout, viewers lose track by sentence three. Structuring your storyboard around a classic visual diagram—a 3-step flow, a split comparison, a funnel, a 2x2 matrix, or a timeline path—lets the viewer's eye see the logic before the voiceover finishes the sentence. Here are the five core diagram layouts that drive high completion rates in vertical explainers.
1. Three-Step Vertical Process Flow (Input → Action → Result)

Because phones are vertical 9:16 screens, stacking three visual stages from top to bottom (Problem → Process → Payoff) matches the natural top-to-bottom scan of the eye. Keep it strictly to three stages so each icon stays large enough to read without zooming.
2. Old Way vs. New Way Split Comparison Card

Side-by-side or top-and-bottom contrast is the fastest way to justify switching to your product or method. Draw the 'Old Way' as a tangled, cluttered path in muted red/grey, and the 'New Way' as a single clean line in bright green or teal.
3. Three-Tier Conversion Funnel Breakdown

Marketing, sales, hiring, and filtering topics click immediately when shown as a wide top intake narrowing down to a high-value output at the bottom spout. Use distinct color bands for the top, middle, and bottom tiers.
4. 2x2 Priority Quadrant Matrix (Effort vs. Impact)

When comparing four options or teaching prioritization, a 2x2 grid with the winning upper-right quadrant highlighted in a bold accent color gives viewers a screenshot-worthy mental model they will save for later.
5. Winding Milestone Roadmap Timeline

Onboarding journeys, 30-day challenges, and company histories work best as an S-curve trail with three flag pins marking Day 1, Day 15, and Day 30. The winding path leads the eye across the frame and creates natural curiosity for the final flag.
A worked production example
A SaaS agency turns a 40-second onboarding pitch into a four-beat Whiteboard Doodle reel using the Old vs. New Split Card for the hook and the Three-Step Vertical Flow for the delivery process.
Before you generate motion
- The diagram uses at most 3 to 4 visual nodes so icons stay large on mobile.
- One accent color highlights the winning path or quadrant.
- Spoken labels sit in clean burned-in captions rather than cramped inside tiny boxes.
Where Scro fits
Scro's Explainer directors automatically plan 6 visual diagram types (Process Flow, Comparison, Funnel, Matrix, Timeline, and Core Metaphor) on one clean wooden board with burned-in hook titles.
Build 6-diagram explainer reels in Scro. Finished samples are on the examples page.